Arctic Research at the University of Maryland Center for Environmental Science
Sir Wilfrid Laurier Arctic Cruise - July 2010
July 4-6
Instead of watching a parade and fireworks on the 4th, I spent most of the day traveling from Vermont to Victoria, British Columbia. With two stops and good connections, it takes just over 12 hours; I left Burlington at 6 AM and arrived in Victoria at 3:15 PM British Columbia time. Dr. Jackie Grebmeier and Dr. Lee Cooper, both from the Chesapeake Bay Lab of the University of Maryland, met me and we drove to visit friends of theirs before heading to the docks to board the Canadian Coast Guard Ship (CCGS) Sir Wilfrid Laurier. On Monday, Jackie and Lee checked on cargo to bring on board while Joanne Haynes, a member of the Australian Navy, and of our team, walked around downtown Victoria. In the late morning, we picked up the last member of our team, Marisa Guarinello, who had come from Seattle by ferry. After spending some time moving, unloading, and tying down boxes of supplies/gear, we drove west along the west coast of Vancouver Island to a provincial park, French Beach. We walked along the beach and found a spot to enjoy a late afternoon meal of fresh fruit, bread, and cheese. Sitting on the beach, we were able to see the Olympic range of mountains across the Strait of Juan de Fuca where we watched what appeared to be sea lions feeding just off shore. When we sailed on the 6th, we traveled through the strait for nearly 6 hours and then continued along the west coast of Vancouver Island for several more before heading across the Gulf of Alaska. The 102-mile long Strait is the regional international boundary between the United States and Canada.
This is my 5th trip on board the Laurier, working with Dr. Jackie Grebmeier. The Laurier, a light icebreaker, patrols British Columbia and Arctic waters. When it isn’t being used for science, the Laurier’s duties include resupply, aids to navigation, search and rescue, fisheries enforcement, icebreaking, ice escort, and other duties related to Fisheries and Oceans, Canadian Coast Guard and other government programs. It’s well suited for science work on board and, with a smaller science team this year, we have lots of room for everyone’s equipment in the lab and on deck. Once we sailed in late morning on the 6th, most of the science team took advantage of time to set up equipment in the lab and to get organized for work to begin the next day. In the afternoon, we all attended a safety briefing and ship orientation. You’ll get to see pictures of the Laurier and our work in future journal entries
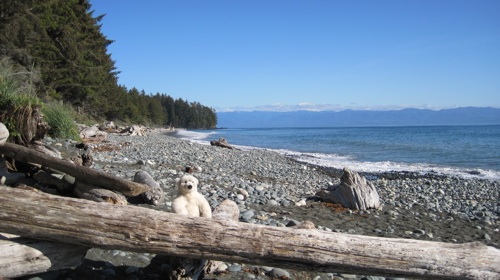
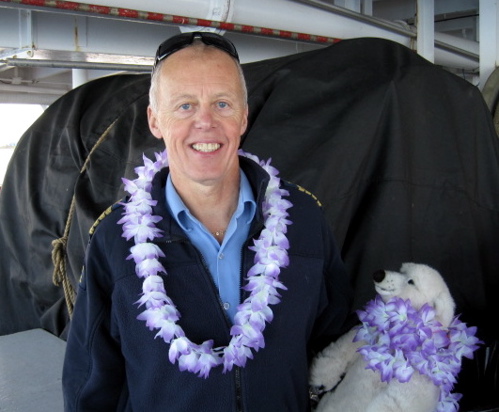
French Beach Provincial Park, Vancouver Island – the bear is PB (Polar Bear) who accompanies me on my sea going trips. The pictures of her adventures become a book for my grand nieces.
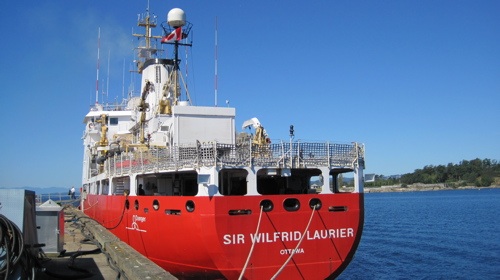
CCGS Sir Wilfrid Laurier at dock in Victoria, British Columbia
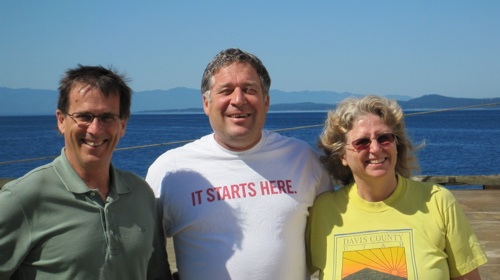
L. to R. Eddy Carmack, Canada’s Three Oceans lead scientist, Institute of Ocean Sciences, Dr. Lee Cooper, Dr. Jackie Grebmeier, both from the Chesapeake Bay Lab, University of Maryland
July 7
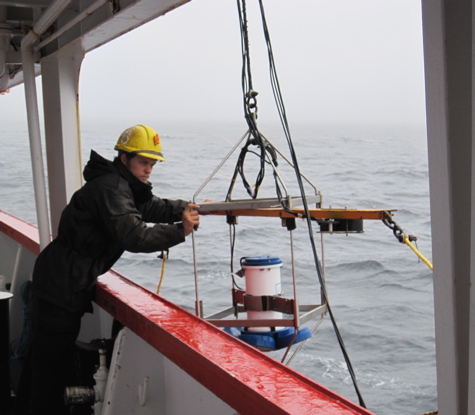
Today I spoke with Kelly Young, an ocean technician working at the Institute of Ocean Sciences (IOS) in Victoria. Kelly has only been at IOS for a year and a half, but she has already been to sea more than five times; she says she just loves going out. She received both her undergraduate and Masters degrees from the University of Victoria, and her specialty is plankton. She is currently collecting samples for Dr. John Nelson, a research scientist at IOS. While we’re crossing the Gulf of Alaska, we’ve been sampling one station each day, lowering the CTD bottle rosette (I’ll tell you all about that in a future journal) and deploying the bongo nets. The bongos are Kelly’s responsibility.
At nearly every station, Kelly will drop two large nets over the side to a depth of 100 m. and then bring them back to the surface vertically. The nets take two samples simultaneously and capture zooplankton (tiny marine animals) in small filter bottles called cod ends attached to the bottom of each net. When the nets come up, Kelly will spray the nets to rinse all of the zooplankton into the cod ends before dumping the contents into buckets to be filtered and preserved. The samples that Kelly collects will be used in two projects. The first is to classify and quantify zooplankton; by preserving these samples in formalin, their structure remains intact and allows the scientists to identify them and thus study species distribution and population size. Kelly will preserve the other samples in ethanol for a study of population genetics. Dr. Nelson can use the genetic data as a sort of "molecular clock," to trace the distribution of genetically distinct populations within a single species.
When I was on board with Dr. Nelson in 2007 I asked him about the significance of his work. He told me that one example was his work with a particularly important Arctic species of zooplankton, Calanus glacialis. He has identified a population found in the North Bering with a unique genotype (the actual DNA an organism has) that can be used as a “tag” to follow dispersal of this population into the Arctic Ocean. This North Bering population moves with the currents almost to Barrow where it turns into the central Arctic Ocean. He hopes to see how this distribution pattern varies with variation in ocean and climate conditions. John calls his work phylogeography or how different populations of the same species are distributed across the landscape and how geography influences their evolution and distribution. Using genetic analysis, scientists can trace the distribution of genetically distinct populations within a single species. By doing so, they can track the dispersal of populations as currents move through the Bering Sea and into the Arctic Ocean. Dr. Nelson published a paper in 2009 about his on-going work. “Penetration of Pacific Zooplankton into the Western Arctic Ocean Tracked With Molecular Population Genetics,” (R.J. Nelson, et al) can be found in the journal Marine Ecology Progress Series.
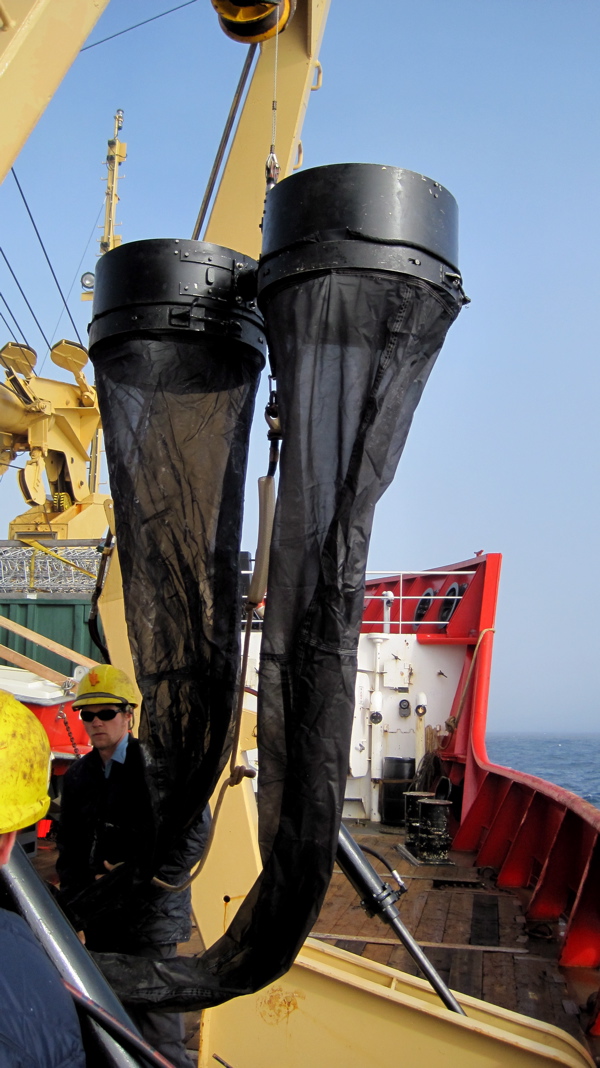
The bongo nets are deployed over the starboard side of the ship.
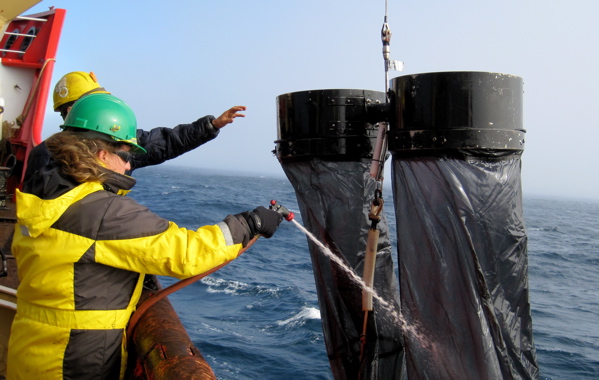
Once the nets come up, Kelly will rinse them to make certain any plankton on the nets are washed into the cod ends.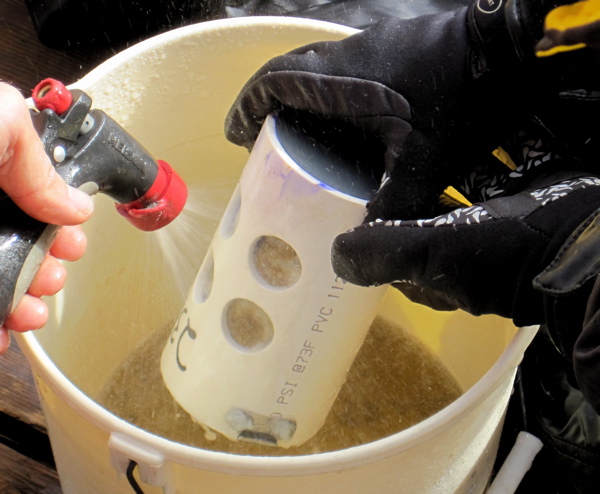
Kelly dumps the material from the cod ends into a bucket and then washes the cod end carefully to make certain nothing is left behind. She told me she find several types of zooplankton, including amphipods (I’ll have a picture of these for you later on when we collect them for our work), copepods (kind of “cute” with two long antennae in the front), small crabs and shrimp, and even jellyfish.
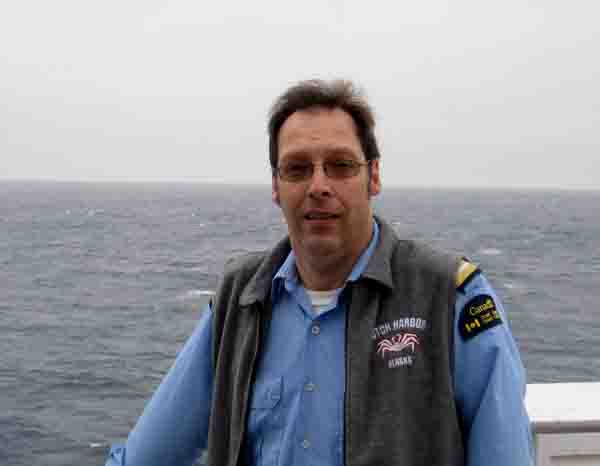
I spoke today with Denis Lambert, the Ice Observer or, as Denis says, “the last of the Ice Observers,” on board the Laurier. Denis is from Quebec, and he’s been doing this work for 20 years. Originally a weather observer, looking from the ground up, he now observes ice from above looking down. He told me that the first ice reconnaissance by airplane was done in 1957 and, soon after, the job of the Ice Observer was to help direct ships through the ice. Early in his work as an observer, Denis worked primarily from helicopters, traveling up to 50 miles from the ship; he now relies on satellite images as well. In 2006, Denis was on board the Laurier when I was, and the ship couldn’t get to Barrow due to exceptionally heavy ice that drifted south from the permanent ice pack. Despite ice-free conditions east of Barrow that year, the Beaufort gyre (a large, wind driven Arctic ocean current in the Beaufort Sea) had pushed the ice into Barrow and south into the northern Bering Sea where the ship was located. At that time, Denis was asked to survey the ice extent from the helicopter to get an idea of when the ship would be able to pass through.
Despite the unusually heavy ice in 2006, Denis indicated that the extent of the Arctic ice is changing rapidly. The lowest summer Arctic ice cover on record occurred just a year later, in 2007. When I asked Denis about changes he’s seen in his 20 years of work as an ice observer, he noted the following:
- you must go further north to find ice in the same time frame
- in the past, old ice (> two years) was strong and solid, and ice breakers often wouldn’t go through, now the old ice is soft and rotten; seen from below the surface, the edges are jagged and the ice is pockmarked with holes
- although the ice cover comes back each year, it is primarily first year ice, not old/multi year ice
- first year ice forms later in the year and moves out earlier
These observations have been substantiated as reported in a WWF 2009 publication, Arctic Climate Feedbacks: Global Implications. “Nearly 40 percent of the sea ice area that was present in the 1970’s was lost by 2007, (the record low year for summer sea ice), and ice-free conditions existed in 2008 in both the Northeast and the Northwest passages for the first time on record. Sea ice has also become thinner. Thick ice that persists for years (multi-year ice) has declined in extent by 42 percent, or 1.5 million square kilometers, about the size of Alaska, between 2004 and 2008 alone.” (p. 8)
When I asked Denis if he felt that the changes were human caused, he replied, “definitely.” He particularly noted the sharp increase in the amount of CO2 in the atmosphere as recorded by multiple studies. Related information can be found at two NASA websites, http://climate.nasa.gov/evidence/ and http://climate.nasa.gov/stateOfFlux/index.cfm Related to the impact of these changes, Denis told me that the seal season was canceled in the Gulf of St. Lawrence last year due to lack of ice, Newfoundland had no ice at all in 2009, and he had photographed changes, over a two year period, in the topography of Herschel Island, in the Beaufort Sea, due to melting of the permafrost.
Thanks to Denis Lambert for all of today’s pictures (except the one of him).
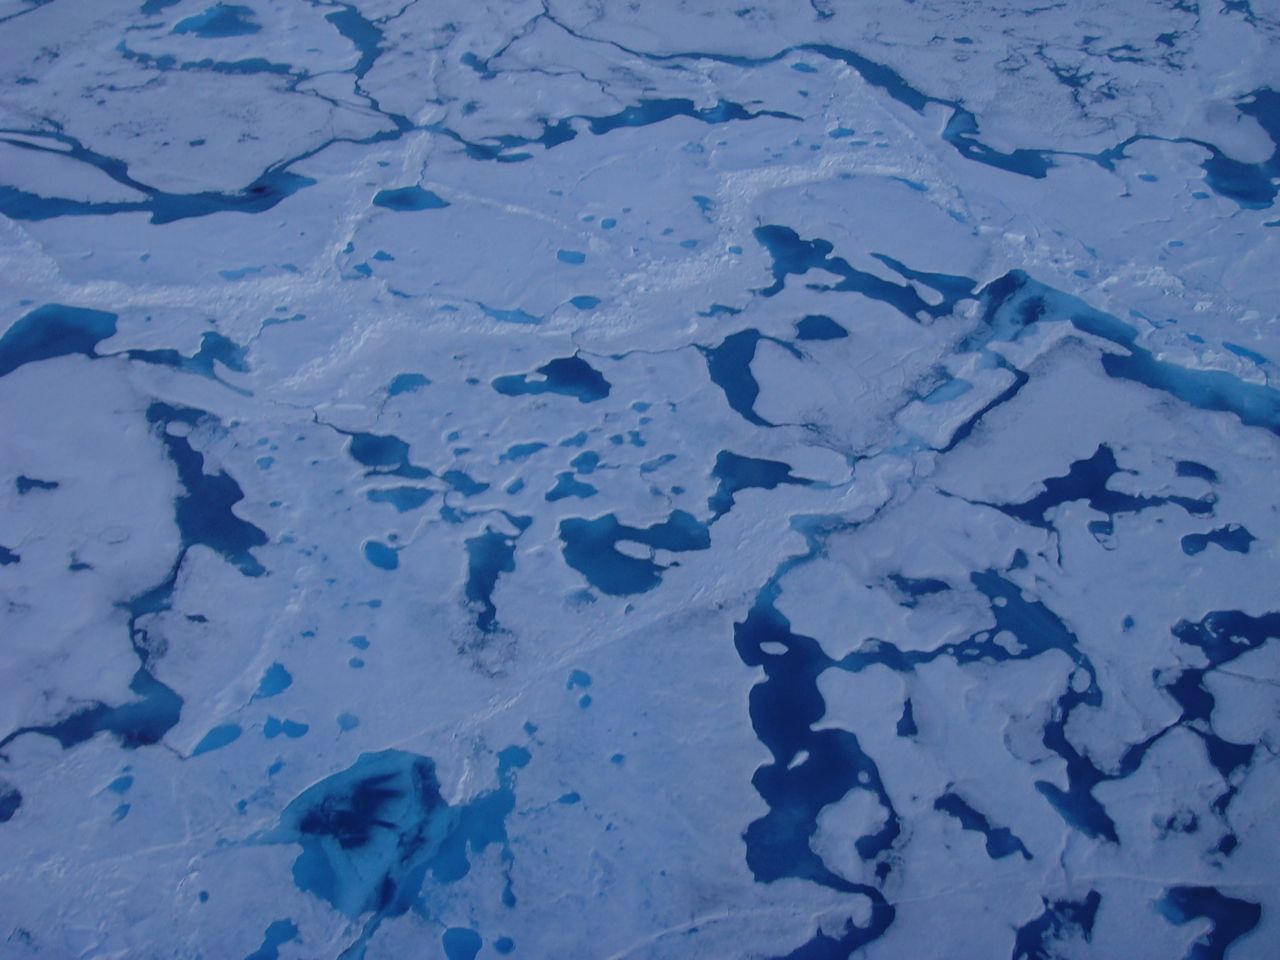
Denis explained that one of the characteristics of multi year ice is the melt pools over very blue ice underneath. In addition, you can see rivulets running between the pools. Both are clear in this picture.
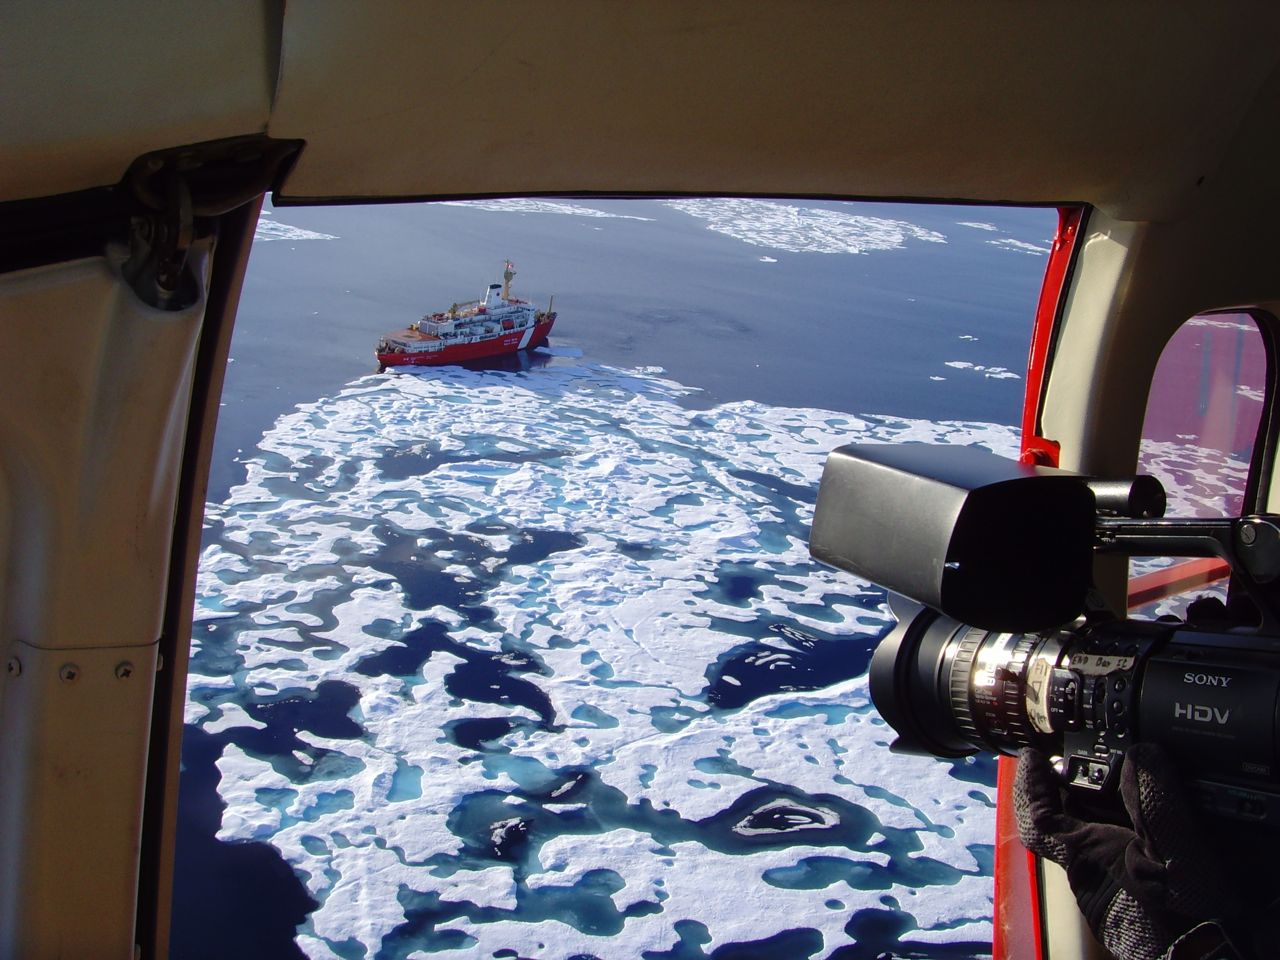
This is what Denis sees from the helicopter. This picture was taken looking down on another CCGS, the Louis S. St-Laurent.
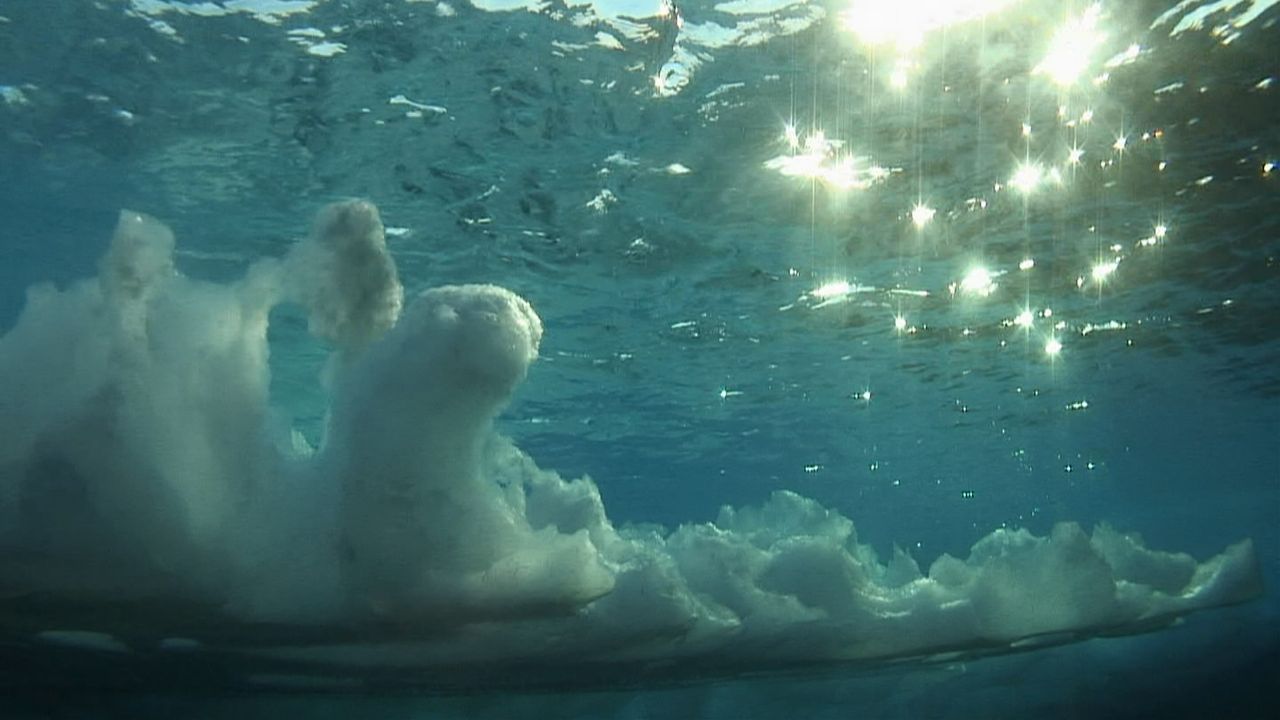
This picture, taken underwater, clearly shows that the old ice found today has jagged edges and lots of holes, making it “rotten” and easily broken up.
It would have been better to take a picture of Denis with ice in the background, but we’re in the Gulf of Alaska where there is no ice. If the winds push the ice south, we may see it before we get off in Barrow.
July 9
Laurie LaPlante is an electrician who works in the engine room of the Laurier. When I spoke with Laurie and he showed me around the engine room, it reminded me that what we sometimes take for granted (that the ship will run smoothly, we’ll have electricity and fresh water on a daily basis, and we’ll get where we’re going) must be maintained 24/7 by those who work in the engine room. Laurie told me that the Laurier, officially a navaid/light icebreaker, is a diesel/electric ship powered by three locomotive engines. She holds up to 1.1 million liters of fuel, and will use 490 liters/hour with one engine, 970 liters/hour with two, and 1450 liters/hour with all three engines running. The three engines will produce 8000 horsepower. The ship carries 101 tons of fresh water, and makes approximately 32 tons/day with an evaporator and by reverse osmosis. Note: some of you will remember, from high school biology, that osmosis is the diffusion of water through a semipermemable membrane. The process of reverse osmosis uses high pressure (900 psi) to squeeze salt water through a membrane that blocks out the salt crystals. Overall, the ship uses 14–18 tons of water each day, with the majority of use from the galley. The ship has a top speed of 15 knots, a little over 17 miles/hour.
The crew in the engine room works a 12-hour watch, 7 days/week, for 28 days, and functions with two engineers on each shift. Since it’s an electric drive ship, the engines are only used for electricity production. Generators will feed the cycloconverter that in turn produces the energy used by the electric motors thus allowing those operating the motors to vary the speed. Operating with fixed propellers means that the ship must be stopped in order to go in reverse. Therefore, when the ship is in ice, they’ll try to maintain speed to allow the bow to ride up on the ice to split it, analogous to opening a zipper. If the bow rides up and the ice doesn’t break, the ice knife, which is a little further back, will cut the ice. When the ship was in dry dock two years ago, the bow was reshaped in order to fracture the ice better, and so the ice knife wouldn’t get caught in deeper ice. Laurie also mentioned that the winches for the derrick are located in the engine room and the derrick is classified as a 20-ton crane. He noted that moving things from the deck into the water isn’t nearly as tough as moving from the water onto the deck because the wave action puts extra pressure on the winch wire as the winch lifts things from the ocean.
Laurie has been in the Coast Guard for 22 years and, when I asked him what changes he’s seen in that time, he listed several. He’s not only noted increased science presence, but also an increase in the number of women among the crew and the science teams. In addition, he’s very happy that his time out at sea is no longer four months each time. When I asked him about changes in the Arctic in general, he immediately replied that the ice has retreated remarkably. He clearly remembers that the ship sometimes sat for up to three weeks trying to get through the ice at Barrow, and he noted that the return trip along was often equally difficult. On one trip, in 1996, the ship returned home to Victoria via the Panama Canal because the ice was too thick to allow passage.
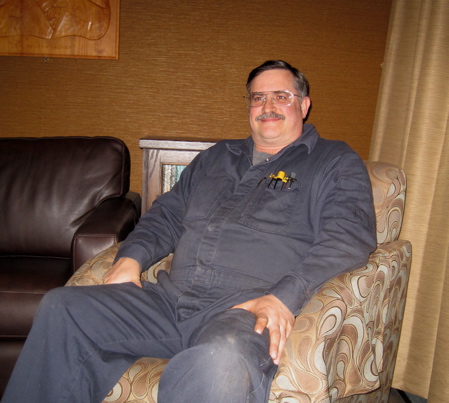
Laurie LaPlante, electrician on the Laurier.

This picture of the ship in dry dock clearly shows the ice knife beneath and back from the bow.
July10
Marisa Guarinello and Joanne (Jo) Haynes are part of our “mud team” this year. Marisa is currently working with Dr. Jackie Grebmeier and Dr. Lee Cooper at the University of Maryland Chesapeake Biological Lab as a technician. She recently completed her Masters degree work at the University of Rhode Island Graduate School of Oceanography, and has been with Jackie and Lee for a year and a half. This is her 4th cruise with them and, when we get to Barrow, the three of them will fly to Nome to board the Moana Wave, formerly owned by the University of Hawaii and now owned and operated by Stabbert Maritime. This COMIDA CAB (Chukchi Sea Offshore Monitoring in Drilling Area Chemical and Benthos) cruise will sample several areas north of Barrow over a five-week period, and will carry a science team of 26, working with a number of different projects.
Jo Haynes is a lieutenant in the Royal Australian Navy where she has served 13 years. Although she’s in the navy, she hasn’t been to sea in over a year as she’s currently living in Monterey, California where she is studying for her Masters degree in physical oceanography. With a fieldwork requirement for her degree, and her thesis work focusing on the effect of oceanic processes on sea ice in the Southern and Arctic Oceans, this spot with Jackie’s team is ideal.
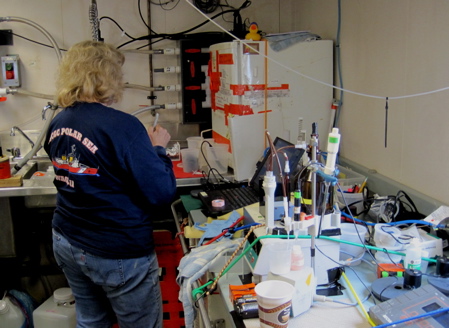
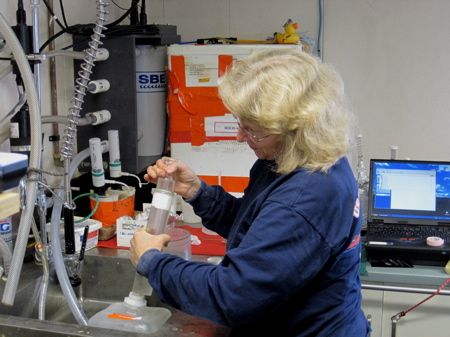
As we head from Victoria across the Gulf of Alaska, we’ve been doing one station each day. A station is where the ship stops to allow science sampling. At each morning station, the CTD bottle rosette is lowered to, among other things, collect water from various depths. (I’ll write more about the CTD in a future journal.) Marisa and Jo will take water from six depths for chlorophyll-a analysis. While many of our samples will be preserved and processed once back in Maryland, Marisa and Jo are processing the chlorophyll-a on the ship. Chlorophyll-a is found in the cells of plants, and is an important indicator of "productivity," or the availability of food in the water. After filtering the water, they place the filters in glass vials in the freezer for one hour to break the plant cells and release the pigments. They then add acetone to extract the chlorophyll-a from the filter into the acetone solution. After twenty-four hours in the refrigerator, the samples are ready to be measured with a fluorometer (I’ll explain more about the fluorometer in a future journal.) Later on, once we start taking bottom samples, they'll also take chlorophyll-a readings, after twelve hours, from two mud samples from the van Veen grab. The tough part about all this is that, once we get going, the samples start to back up, and someone needs to get up at all hours, day or night, not only for the CTD casts and the mud work, but for taking chlorophyll readings as well.

Marisa and Jo check their data table before sampling.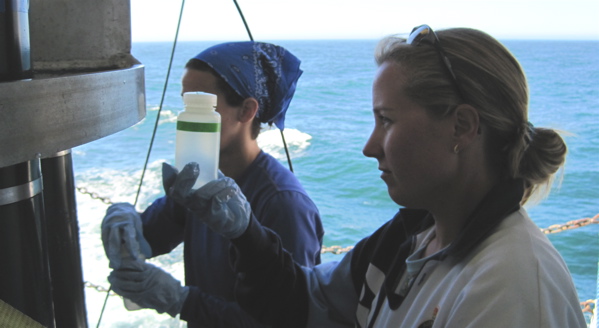
Jo is collecting water from the CTD to analyze for chlorophyll-a.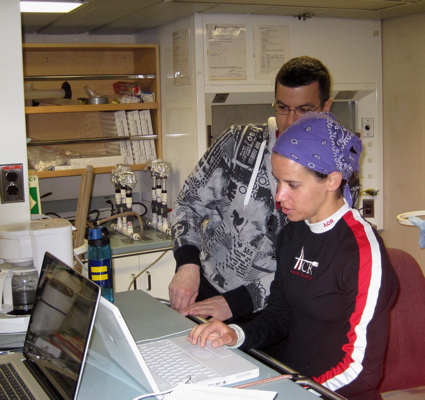
Marisa spends much of her time up in the lab entering data. Gerald Rohatensky, computer specialist on board was helping her with a tricky hard drive.
July 11
Emily Hill has a unique summer job. After graduating with a degree in environmental chemistry, she began working as a research assistant working with Celine Gueguen at Trent University in Ontario. When Dr. Gueguen needed someone to come out on the cruise to collect samples Emily stepped up. Despite the fact that this is her first time out to sea, Emily has settled right into the routine of collecting samples from every CTD cast and taking readings every 6 hours, day and night, from surface sea water continually being drawn into the lab
Emily is collecting CDOM (colored dissolved organic matter) from the water collected by the CTD at various depths from 1000 m. to close to the surface at 5 meters. She attaches a tube to the CTD bottle and uses a syringe with a filter over the end to collect the water. The filter ensures the isolation of CDOM by blocking out anything larger. She’ll then store her samples in amber colored bottles in the refrigerator to prevent degradation.
Once the samples get back to the lab in Ontario, they will be analyzed with a fluorometer (similar to what Jo and Marisa are doing on board), to look at fluorescence in order to characterize CDOM. They’ll shine a light on the sample, which will not only absorb the light at certain wavelengths but also emit light. With this information from each sample, they can create a 3-D graph allowing them to compare the results from different depths and to compare it to the data they get from the surface water samples in the lab. I asked Emily about the importance of this work, and she told me that CDOM isn’t easily characterized; it’s a mixture of lots of things (e.g. decomposing organic matter). For now, they are simply trying to find out what’s there to provide baseline data.
We’re getting closer to Unimak Pass where the ship will turn to head into the Bering Sea. You might know the area because the town just the other side of the pass is Dutch Harbor, known to many through the television series, Deadliest Catch. Once we’re in the Bering Sea, sampling will be on a different, more frequent schedule. I’ll keep you posted. I’ve included a cruise map below so you can follow our progress.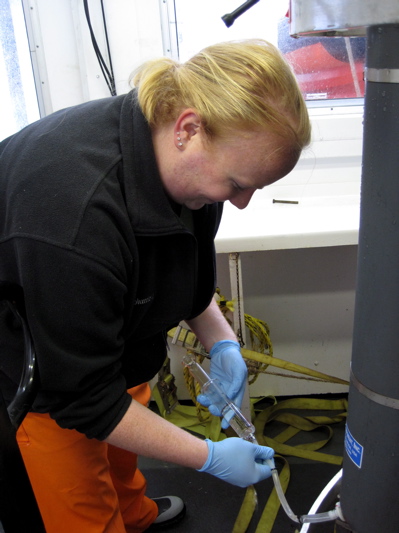
Emily Hill is taking her samples from the CTD bottles using a filtered syringe in order to isolate CDOM
Check out the cruise map to see where we’ve been and where we’re headed.
July 12
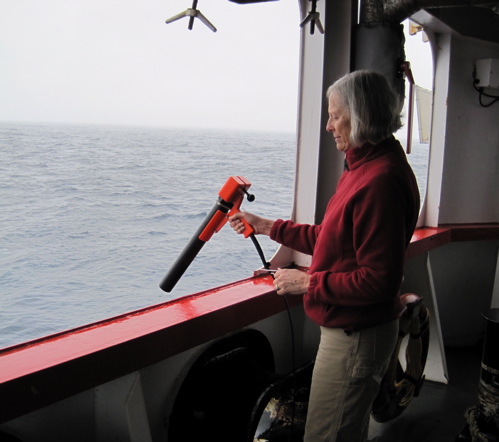
Stephanie King is back on the Laurier for the third time, collecting samples and overseeing work with the CTD. Stephanie works with the satellite oceanography and remote sensing group at the Institute of Ocean Sciences in Victoria. Satellites provide a large spatial map and will get global coverage every three days, providing the skies are cloud free. However, the satellites can only look at surface water, so Stephanie also puts fluorometers at various locations, usually on buoys close to shore, for calibration.
I’ve mentioned the fluorometer before, and Stephanie gave me an explanation of how it works. As you know, plants contain chlorophyll, which uses sunlight in the process of photosynthesis. Plants absorb light in the blue and red range, and reflect green wavelengths (which is why most plants appear green to us.) They will also give off light (fluorescence), which can be measured. The fluorometer measures the fluorescence of chlorophyll, which gives an indication of the concentration of phytoplankton. This works because phytoplankton are small, drifting plants, containing the chlorophyll needed for photosynthesis. When Steph collects her CTD profiles from various depths, she’ll compare her results with those that Marisa and Jo get in the lab, and she’ll use the results of the surface water to calibrate with the satellite data.
Steph is particularly interested in the Antarctic algal super blooms where there are very high concentrations of chlorophyll. These types of blooms do not seem to occur in the northern latitudes. She doesn’t know if it is related to ice formation, if the chlorophyll maximum is at a depth not “seen” by satellites, or it there is another reason.
When doing her work with the CTD, Steph makes certain that communication between the sensors and the computer is all OK. The CTD collects data on conductivity, temperature, and depth, and sends it all back to a computer. Also attached to the CTD are sensors for measuring chlorophyll fluorescence, CDOM fluorescence, light, dissolved oxygen, light transmission (transmissometer) and nutrients. The transmissometer shines light at one end of a water filled gap, over a 25-centimeter (about 10 inches) length, to the other end. The amount of light that reaches the other end gives an indication of the clarity of the water.
The CTD is lowered over the side of the ship in a frame that also carries a rosette of 12 water sampling bottles. These bottles are designed to close when triggered and so can collect water from different depths. So far, we've done CTD casts once a day, sending the rosette to 1000 meters, and then raising it, closing the bottles at a set series of depths. The best data from the CTD is collected on the way down when the water is undisturbed by the rosette.
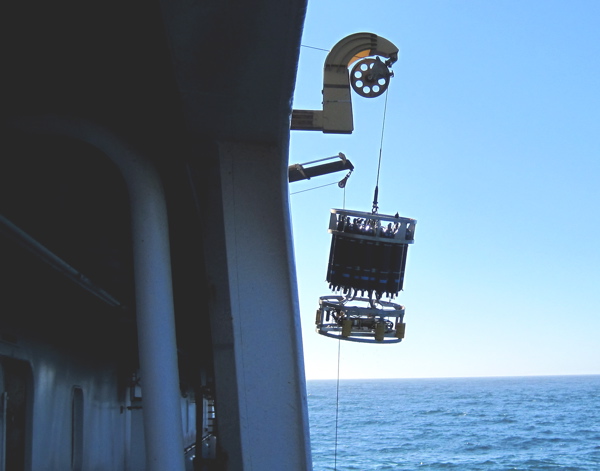
The CTD bottle rosette is deployed over the port side, and you can see it here as it comes back up to the ship.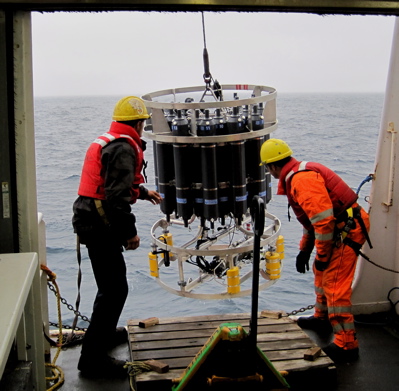
When the CTD gets close, two members of the crew will bring it into an area where the scientists can access it to collect
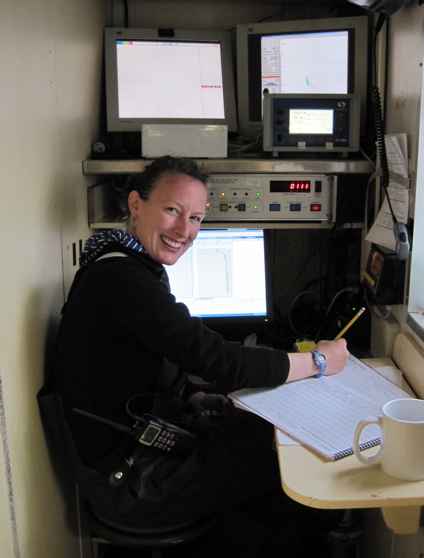
Stephanie sits in the “CTD shack” and watches her computer in order to guide the CTD and to make certain that everything is functioning as it should while the CTD is in the water.
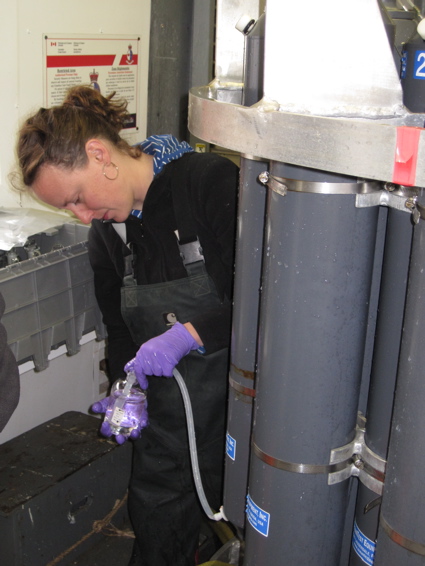
Stephanie also collects water samples for alkalinity, CDOM, nutrients, barium, O18, and salinity.
July 13
Dr. Svein Vagle came to Canada as a student in 1983, and he’s been in Canada ever since. He’s currently a research scientist at the Institute for Ocean Sciences (IOS), Department of Fisheries and Oceans in Sidney, British Columbia and he is an associate professor, limited term (renewed every 5 years) at the University of Victoria. He first went out to sea in 1984, and has been out frequently since then, spending a lot of his time on U.S. ships. He only recently began working in the Arctic. As chief scientist for this cruise, it’s Svein’s job to coordinate the work at each station, making certain that everything happens at the right time. Svein mentioned that, during the International Polar Year (IPY) in 2007-08, there was extra money to replace old equipment and, as a result, things have been running quite smoothly. In addition, this is a relatively small science team, and there’s enough space in the lab, time during the cruise, and water in the CTD to go around.
This cruise is a part of the, Canada’s Three Oceans (C3O) program; Jackie Grebmeier is the US Scientist Lead. Jackie gave me a flyer she had drawn up for the local communities, and it gives the following overview of the C3O program:
- The Canada Three Oceans (C3O) program combines efforts by Canadian and US universities and government laboratories to monitor physical, biological, and geochemical factors affecting changes in climate.
- Aboard, we collect data on distribution of physical, biological, geochemical parameters from the ocean water column along the ship’s annual track from Victoria to its Arctic operations as part of climate monitoring.
- In addition, plankton and benthic sampling occur at sites in the Bering Sea north and south of Bering Strait, including occupation of >20 yr time series studies for detecting ecosystem change.
- Longer-term integration of oceanographic change is reflected in many water column and sediment indices as well as changes in top predator populations (marine mammals, seabirds and fish).
In addition to overseeing the science on board, Svein is responsible for a series of additional instruments/sensors on board. I’ve included pictures of each of them. One is the Acoustic Doppler Current Profiler (ADCP). Although the ADCP is permanently mounted on some ships, on the Laurier, it’s lowered at each station to monitor throughout the duration of the station. The purpose is to look at and map currents and plankton layers, primarily zooplankton.
In the lab are two unusual looking, but highly functional pieces of equipment. The gas box (actually two black boxes) sits atop the gas cooler. There are two intakes to the system, one from continuously running sea water (the loop) via the gas cooler and one from outside the ship through an open window in the lab. Inside the cooler are an oxygen sensor and a gas tension device, actually a membrane sensor, which measures total gas tension or the pressure of all the gases in the water. Because the seawater passes through inside the cooler, it remains at close to natural temperatures. Since 99% of our atmosphere is composed of nitrogen and oxygen, and the sensor measures total gas, you can subtract the oxygen and arrive at a value for nitrogen. Thus, the system is actually both an oxygen and a nitrogen sensor. Svein is interested in separating the biological component of the oxygen signal from the overall signal. Biological processes change the oxygen concentration – phytoplankton produce it, and zooplankton and bacteria use it. However, physical processes such as storms, breaking waves, and rough seas and changes in temperature can also elevate oxygen. Thus, when both the nitrogen and oxygen are elevated together, it’s the result of physical processes. When the oxygen is elevated independently of the nitrogen, it’s a result of biological processes. Svein will try to relate all of this data to the data from the bongo nets and the ADCP and, when looking at all of the data from the transect, he hopes to relate it to climate change.
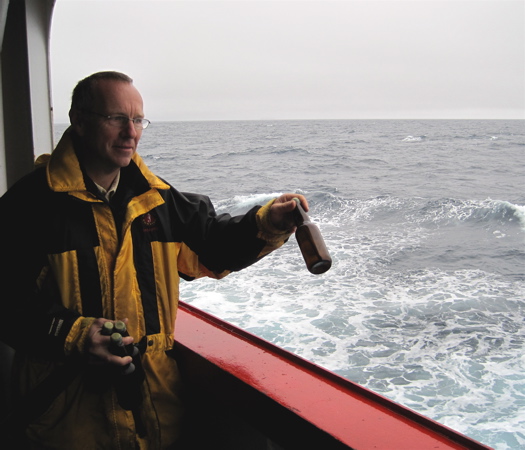
Three times a day, Svein releases an XCDT off the stern. The X in this case stands for expendable. After the XCTD is “fired” off, it drops to 1100 meters, sending temperature and conductivity (which translates to salinity) data back to a computer. Once the instrument reaches 1100 meters, the wire is cut to release it. Although the data from the XCTD is courser than that from the CTD cast, the XCTD data fills in the 24-hour period since we’re only doing one proper CTD cast/day.
In addition to the projects related to C3O, there are two other projects taking place during the cruise. Similar to the old “message in a bottle,” is the IOS project designed to track currents. Svein tosses out 10 bottles at a time, each with a message inside, asking the finder to send an email to IOS with information about where the bottle was found. He dropped the bottles once a day early on, but has been dropping them every 2-3 hours as we’ve moved along the Aleutians. Although the return has been low on the bottles, scientists at IOS are still hoping to collect data to identify, among other currents, a possible huge Pacific gyre and maybe a current heading toward Japan. Now that we’re into the Bering Sea, he’ll toss out fewer bottles since the currents here have been much better mapped.
Lastly, Svein deployed 4 Argo floats as part of an international program (Svein believes there are approximately 4000 floats out worldwide. Unfortunately, by the time I got onto the ship’s e-mail and read the following message from the captain, Svein had deployed all 4 floats. Thanks to Captain Taylor for the following:
Most of you would be aware of the 4 Argo floats we have and will be deploying on our North Pacific Transit. These have been deployed throughout all areas of the ocean in the past 10 years, by numerous countries, and basically allow scientists and the general public to access the web site and monitor the buoys’ locations and readings. The buoys actually sink to 2000 meters for 9 days and then traverse the water column sampling en route. Once on the surface they transmit their data and sink for another 9 days. A detailed explanation of how this actually happens is below. Also the web site below provides the maps and links to the data.
The crew deploys the Acoustic Doppler Current Profiler (ADCP) at each station, just before the CTD goes into the water.
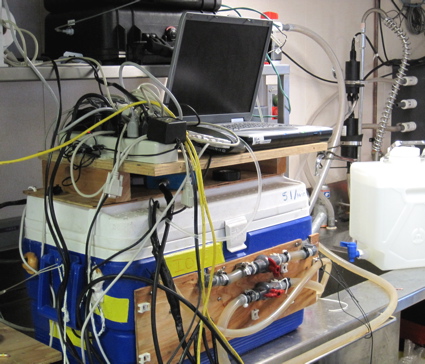
You can see all of the blue gas cooler and part of the gas box (two black boxes on top of the cooler) in the picture taken in the lab.
Svein allowed me to “fire” the XCTD from the stern. Here I’ve fired the XCTD which was loaded in the “gun” I’m holding, and I’m waiting for it to reach 1100 meters when the wire will be cut to release it.
Svein is getting ready to throw one of the drift bottles over the side.
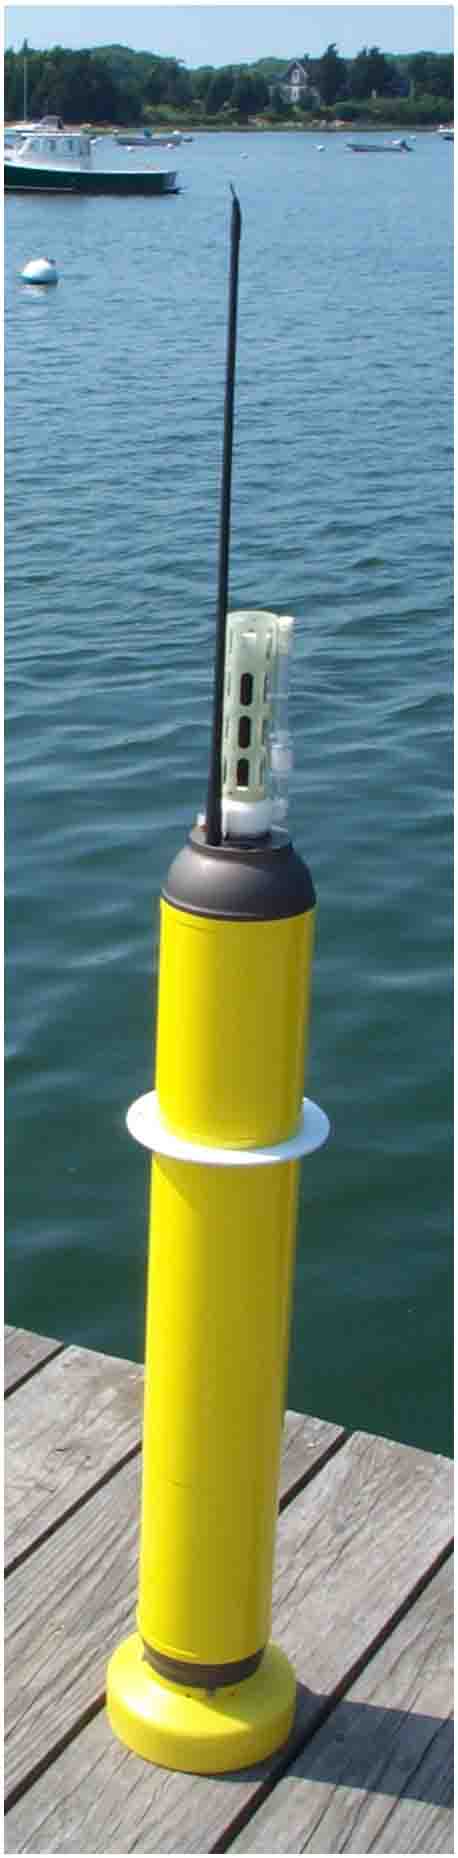
An Argo float, part of a huge network of these floats around the world’s oceans.
July 14
We’re finally in the Bering Sea and moving north toward the first of our mud stations. Once we start, things will get pretty busy, and we’ll be working around the clock. Since this is my 7th trip with Dr. Jackie Grebmeier, I have a pretty good idea of the work we’ll be doing, so I thought I’d tell you about it before I get too busy. But first, a little bit about Jackie. When I first traveled with Jackie, she was at the University of Tennessee at Knoxville, but she’s now at the Chesapeake Biological Laboratory (CBL), University of Maryland Center for Environmental Science (UMCES). Jackie’s husband, Dr. Lee Cooper, is also on this cruise, and you can read about their work both in the Arctic and elsewhere, at http://arctic.cbl.umces.edu.
Jackie’s research involves benthic organisms, those that live at the bottom of the ocean, and she’s been doing work in the Arctic since 1984. On this cruise we’ll be sampling in three “hot spots” in the Bering and Chukchi Seas where the water is shallow and most of the food in the water column goes to the sediments. Jackie has studied these areas for a number of years and thus has a time series that helps her to understand the ecological forces at work in the water column and the sediments. For example, she’ll look at the carbon supply to the sediments, recycling of carbon in the sediments, and the community structure (what’s living there) of the invertebrate macrofauna (large animals without backbones). The hot spot areas are also important because they’re home to important top predators such as the spectacled eiders, gray whales, and walrus.
Jackie has seen a distinct decline in the populations of the dominant invertebrate fauna in the last 17 years in these three areas. The changes seem to be related to changes in current flow, water temperature, and carbon supply. The population of amphipods (small, pink, shrimp-like animals), for example, has declined in the Chirikov basin, north of St. Lawrence Island in the Bering Sea. The gray whales that feed on the amphipods have now moved further north in search of food. This entire area is critical because all of the major water masses of the Bering Sea come together through the Bering Strait and move into the Chukchi Sea. As I mentioned the other day, when the rest of us head home after leaving the ship, Jackie and Lee will go out on another cruise, for more detailed work in the Chukchi Sea including the S. E. Chukchi Sea hot spot. Combined with their earlier month-long cruise in March, they will have been out to sea for nearly three months by the end of August.
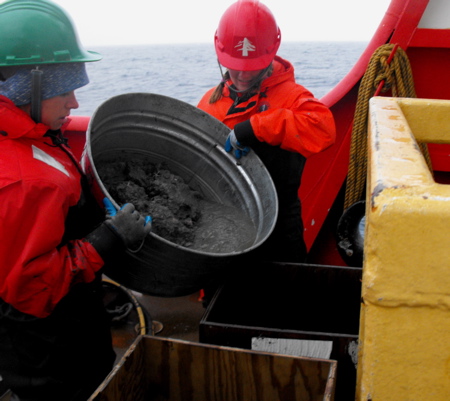
So - here's a review of all that will be happening at our mud stations. First there's a CTD cast off the port side. As soon as that's done, the crew moves to the well deck up front, assists with the bongo nets (zooplankton tow), and we start our mud work. We need to get 5 van Veen grabs and 2 good Haps cores at each station. The van Veen scoops mud from the bottom while the Haps core brings up a core sample of the sediments. While that should mean 7 times up and down with the winch, it often means more when it's difficult to get good cores due to mud conditions, rough water, or if the van Veen or Haps doesn’t function properly. The first time the van Veen comes out of the water, someone will take samples off the top for sediment grain size determination, TOC (total organic carbon) and for sediment chlorophyll analysis. By analyzing the sub samples, Jackie gets information about the phytoplankton and how long it has taken to reach the sediments, the forms of carbon and how much of it arrives at the sediment surface from the processes taking place in the overlying water column, and the type of organisms in the mud. Analysis of the sediment grain size gives an indication of current speed as well as the physical environment the animals live in.
For the next 4 van Veen grabs, we’ll dump the mud into sieve boxes where we spray clear all the mud with hoses and preserve the organisms left behind to get an idea of what lives at the bottom and how it interacts with its environment. A typical grab might include lots of different worms and clams, but we can also expect to find snails, starfish, sea anemones, shrimp, and amphipods (small, shrimp-like creatures that are food for grey whales). At one of our stations further north, we’ll find lots of sand dollars, favorite souvenirs for many on board.
When the van Veen grabs are done, Jackie will send down the Haps corer to get a core sample of the bottom. When she gets 2 good undisturbed cores, about 2/3 full of undisturbed mud with a layer of seawater on the top, she'll take those for her 12-hour respiration experiments. She’ll place them in refrigerators and allow the organisms to remain in their "natural” environment, so she can study total community metabolism. She measures the flux of dissolved oxygen during the experiments to give her an indication of carbon supply to the benthos. In addition, she’ll take measurements of nutrients and water for carbon dioxide exchange over the course of the experiments. Once she’s completed her respiration work, we’ll sieve the core mud and preserve the organisms.
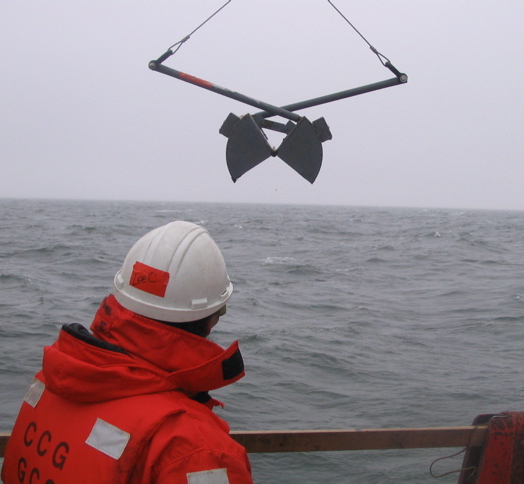
When the van Veen goes into the water it’s open.
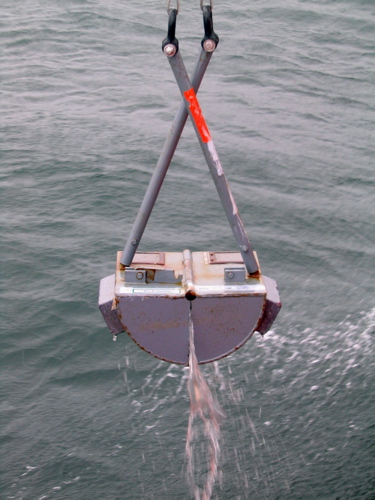
Here’s the van Veen coming back up, as it should, filled with mud from the bottom.
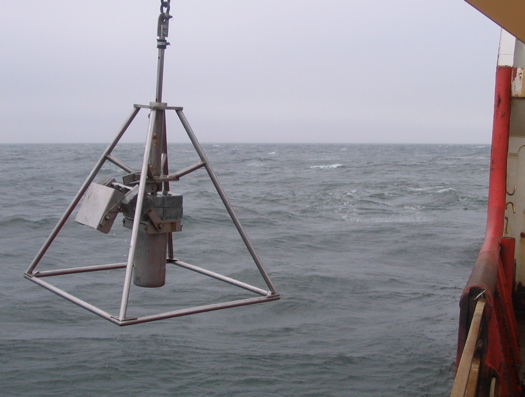
The Haps core also goes to the bottom, but it takes a core sample of the mud.
July 15
When I last traveled on the Laurier, Michael Bentley was on board watching for birds and marine mammals, and I distinctly remember how passionate he was when talking about birds and about wildlife in general. Nothing has changed; he’s as dedicated and passionate as he was then. Michael is a contractor from Victoria, when I asked him to describe his role on board, he replied, “birdman.” Whenever the ship is steaming, Michael is in the wheelhouse watching for birds and marine mammals. He surveys an area 300 meters wide on one side of the ship in order to do an inventory of the birds. He not only records species and numbers, but also other information including flight direction, general behavior, and plumage. He tries to determine if anything in the local area is influencing the birds’ behavior such as being attracted to the ship, tide lines, oil slicks, floating debris, or even association with marine mammals. Although he’s seen relatively few birds for most of the trip, he did see an overwhelming number, 1000’s per hour, on the shelf northwest of Dutch Harbor. No one knows for certain, but there are any number of reasons why so many birds might gather in one spot. It could be related to the presence of fishing boats or plentiful feed.
While on board, Michael also watches for marine mammals, and he’s seen quite a few whales, including the sei whale. When he first mentioned it, he said he wasn’t certain about the pronunciation because some pronounce it “see” while others pronounce it “say” and still others say “sigh.” After that, he had a chance to talk with Svein, the chef scientist, who is originally from Norway. Svein told him that these whales would often be seen following the pollack, a common fish, and that the Norwegians had named it the pollack whale. Pollack in Norwegian is sei, and Svein said the pronunciation should be “sigh.” I had often seen the name in the past and had wondered about how to say it. Now I know.
We’re still south of Little Diomede Island, and Michael is hoping we’ll be able to go ashore (it will depend on weather, timing, and where we are in the science program). If we get to Diomede, Michael will undoubtedly carry his camera and lenses ashore since Little Diomede is home to a large breeding colony of three species of auklets (least, crested, and parakeet), and Michael will want pictures of the auklets and other birds he might find on the island. Throughout our trip, Michael hopes for clear skies. Unfortunately, since coming into the Bering Sea, we’ve had fog at least 80% of the time. As a result, Michael spends most of the day, from approximately 9AM until midnight, watching from the bridge in order to catch the few patches of clear skies. All of the data that he collects will go to the Canadian Wildlife Service. Michael loves being on the ship and he loves his job. When the rest of the science team gets off in Barrow next week, he’ll remain on board for the duration of Leg 1 of the cruise, another 3.5 weeks.
For a few days, several in the science team and some of the crew members have been decorating standard size Styrofoam cups with colored waterproof markers. Yesterday we stuffed each cup with paper towel to hold the shape and placed them into a large onion bag from the galley. Yesterday was our last deep cast, 1000 meters, so we attached the bag to the side of the CTD and sent it down. If you think of what happens to your ears when you dive even 3 meters into a pool, imagine the pressure on the cups at 1000 meters. The pressure shrinks them to approximately 1/3 their original size, some with a uniform shape and some pushed into bizarre patterns with oddly placed bulges or indentations. Check out the picture below for the before and after photos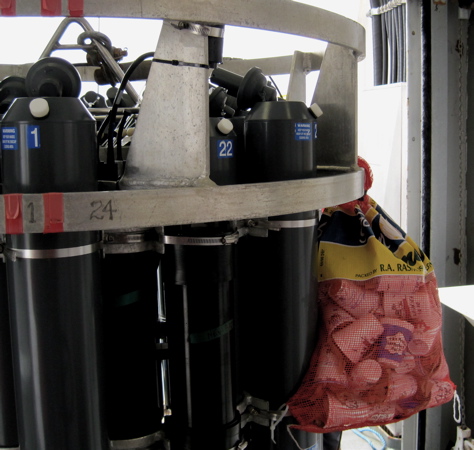
Check out the bag of cups on the side of the CTD.
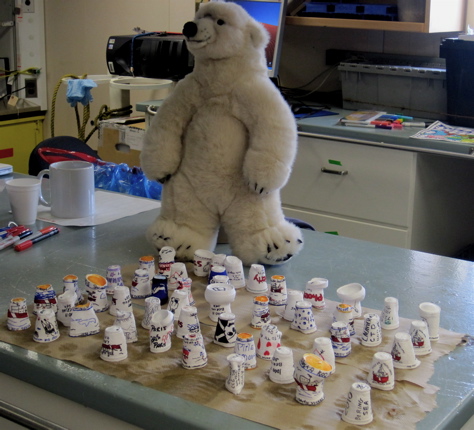
These are the same cups that nearly filled the bag on the way down.
July 16
I first worked with Dr. Lee Cooper in 2002 on board the U.S. Coast Guard Cutter Healy, when I was on my first cruise with Jackie, and I have worked with him on other cruises as well. One of Lee's research projects involves collecting arctic seawater to analyze for oxygen-18, an isotope (different form of the same element, this one with 2 extra neutrons) of oxygen. By analyzing the ratio between oxygen-18 (16O) and oxygen-16 (16O), Lee can track the source of the fresh water components of the water he is sampling; these include melted sea ice as well as precipitation. At these latitudes, colder temperatures result in precipitation that is depleted in 18O relative to the fresh water component of melted sea ice. As the Japanese current, Kuriosho, comes across the Pacific, it splits upon reaching the coast of North America. It heads south to California and north to become the Alaskan current that runs along the southern coast of Alaska and the Aleutian Islands. As this current reaches the passes through the Aleutians, it and the Alaska coastal current with freshwater and glacial runoff from the mountains along the Alaska Coast turns north into the Bering Sea. You might remember from a previous journal, that we traveled through Unimak Pass into the Bering Sea. The Unimak pass is the first pass where Pacific water freely flows from the Pacific into the Bering Sea. Lee should be able to tell, in general terms, if the components of the fresh water are from Japan or from the rivers, glaciers, melted sea ice and melting snow of Alaska or both.
Although it sounds abstract, figuring out how much freshwater is contributed to the Arctic Ocean by melted sea ice versus freshwater that has fallen as rain or snow helps in developing a freshwater “budget” for the Arctic, which is more heavily influenced by freshwater than the Atlantic, Pacific, or Indian Oceans. The large amount of freshwater that flows from arctic rivers and also through Bering Strait from the Pacific controls how stratified the water is, and this freshwater together with the freshwater that comes from sea ice melting in the summer actually puts a cap of fresh (less dense) cold (near-freezing or freezing) water on the surface of the Arctic Ocean. This cold freshwater cap is the reason the Arctic Ocean currently has ice cover. Several hundred meters below the ice covered surface, the water temperature rises significantly above freezing, so if the cold freshwater cap were not there, there would be no ice in the Arctic Ocean. Of course as air and water temperatures rise, there is growing concern that the ice cover will disappear at least in the summer, with or without the cold freshwater cap on the Arctic Ocean surface.
Although Lee is collecting water for oxygen-18 analysis on this trip, he’s also been a huge help to me by putting together a web page for my journals. Each time I’ve traveled with Jackie, I’ve written and posted a journal while on board, and some are still archived on the web. In September, while on the RUSALCA cruise, Lee was at CBL/UMCES where he was able to post my journals. Because he’s here and we can’t post large files from on board, my journals have been shared through the ship’s internal folder, and they’ll be posted when Lee has time, either in between cruises or once he returns home. It’s always a bit tricky for me to post my journals to a website off the ship, but now, after watching Lee put together this site for my journals, I have a much better appreciation for the work involved in setting up and maintaining such a site.
Lastly, Lee always helps with all aspects of our work on deck. He’s done it many times, and he knows exactly what needs to happen every step of the way. The pictures below are of the mud work we do on deck. Thanks to Ben Axmann and Kelly Young for taking pictures while I was working.
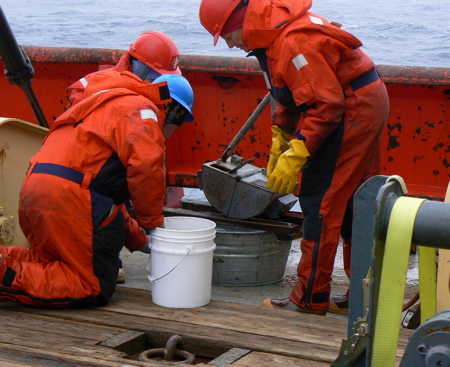
When the van Veen first comes on deck, we take sub samples from a small door in the top, before the mud gets dumped into the bucket below. (photo by Ben Axmann)
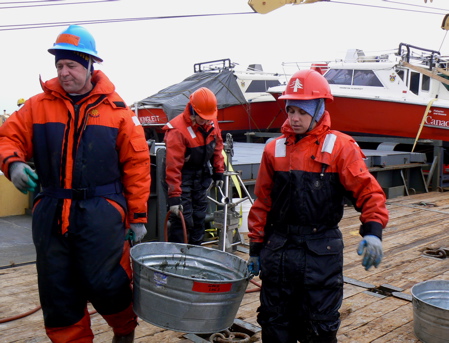
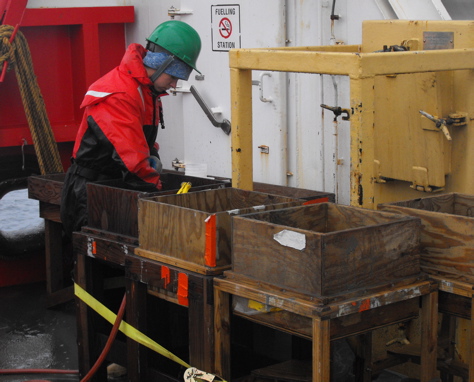
Once the mud is dumped into the bucket, someone (in this picture, Lee Cooper and Marisa Guarinello) carries the mud to the sieve boxes. (photo by Ben Axmann)
The mud is then dumped into the sieve boxes where it is cleaned with salt water. (photo by Kelly Young)
Marisa Guarinello is using a hose to clear the mud from the organisms. (photo by Kelly Young)
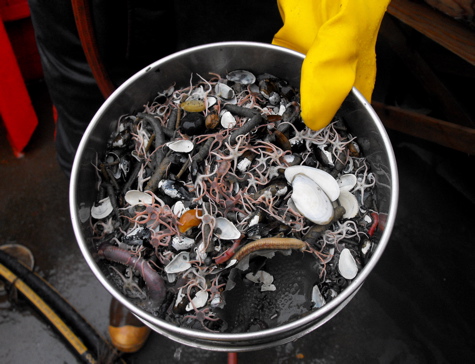
Although we find a variety of organisms in the grabs, this one, full of brittle stars, is typical for this particular site. (photo by Kelly Young)
It’s probably obvious that this picture was taken on a different day since it’s sunny. But, it’s a great picture of Jackie checking out a good core, with Lee looking on in the background.
July 17
Since most of Jackie’s work over the years has been in the Bering Sea, I thought I’d tell you a little about it. Throughout the trip, I’ve been asking those who have been coming here for many years, about changes they’ve seen, and I’ve written about their responses. As you read about the Bering Sea, think about what some of these changes might mean for this area, the people who live here, and the organisms that are part of this fragile ecosystem. I’m using a 1999 publication from the Alaska Geographic Society, The Bering Sea, for information. Even though it’s only 11 years later, much has changed since this was published.
The Bering Sea is bordered by Russia on the west and Alaska on the east. North Pacific waters flow into the Bering through the Aleutian Island archipelago, and pass through the Bering Strait (only 55 miles wide) into the Chukchi Sea of the Arctic Ocean. The Bering Sea sustains the richest marine ecosystem off the coast of the United States, and is one of the most productive on Earth, but even this 1999 publication notes “there are indications of a decline in this vast productivity, signs of an ecosystem in flux, or even distress. Some key species are experiencing dramatic drops in population, leaving scientists, fishermen, Natives, and environmentalists unsure what lies ahead for the remarkable Bering Sea.” With science cruises such as this one taking place in the Bering on a regular basis and additional science work taking place on land, scientists are hoping to not only track these changes but to begin to understand why they are occurring.
The Bering supports 450 species of fish, crustaceans, and mollusks, 50 species of seabirds, and 25 species of marine mammals, including whales, walrus, sea otters, seals, and Stellar sea lions. Several of these species are list as threatened (likely to become endangered in the foreseeable future), endangered (likely to become extinct in the foreseeable future), or depleted (when the population falls below its optimum sustainable levels). However, studying these animals in an area the size of the Bering Sea is no easy task, and trying to decipher the reason for the decline is even more difficult. Human pressures such as hunting and over fishing certainly take a toll, but environmental factors are key as well in a system with a relatively simple food chain, but a complex set of biological and physical controls.
The islands and coastlines of the Bering Sea are home to many Native communities several of which depend on the sea for a majority of their food and for materials for their everyday life. The dwindling populations of fish, birds, and marine mammals threaten the future of these communities, and sea level rise (a result of warming temperatures) poses an additional threat. One example can found at Shishmaref, a community on the island of Sarichef, just north of the Bering Strait. The village lost so much land due to erosion, that homes and buildings have begun to slide into the sea. The village will be relocated to a new area along the Alaskan coast.
In recent years, scientists have worked to share scientific knowledge and incorporate traditional knowledge or involve local residents in observations and research. For example, Jackie and Lee worked on Little Diomede Island as part of a pilot project to sample water flowing through Bering Strait and they have also shared research results with residents of Savoonga and Gambell on Saint Lawrence Island. In other cases, they have brought local hunters out to sea on icebreakers so that they can return to their communities with information about the work scientists are doing in the Bering Sea. Other developing initiatives include school exchanges between Savoonga and a school in Maryland where Deanna Wheeler, an elementary school teacher, and also a participant on a Bering research cruise in 2009, is helping to share information and build relationships between children living both on Saint Lawrence Island and in suburban Washington D.C.
When I asked Jackie about the changes she’s seen since beginning her work in this area, she told me that, in this past year, the winter ice extent in the Bering Sea was the highest since the 1970’s. However, she also said that the ice was thinner and moved out earlier in the spring. In addition, she told me that the Chukchi Sea, north of Bering Strait is a much better indicator for climate changes as it is most tightly coupled to the Arctic in general. It’s in the Chukchi Sea where scientists have recorded the much greater ice retreat overall. In general, scientists are seeing a very different system than that of the 1980’s. Scientists have recognized that there is a need to occupy these stations as much as possible throughout the year, and a new project, the Distributed Biological Observatory is being piloted this summer. With participation from five countries and eight ships, scientists will collect measurements of temperature, salinity, chlorophyll, zooplankton and benthic organisms to contribute to a more complete picture of this area.
Note: Thanks to Lee Cooper for adding the information about his and Jackie’s work with the Native communities.
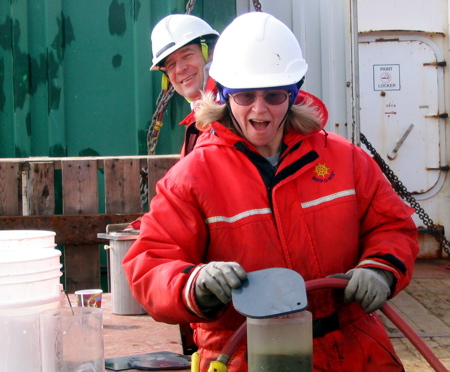
Jackie’s set up in the lab includes all of the equipment she uses for her respiration experiments.
This is a better picture because you get to see Jackie.
July 18
Last night was a long one as we did a series of stations across the Bering Strait. They started at 3:00 PM and wrapped up around 5:14 this morning. With the ship steaming in between, we usually had only 1 – 1.5 hours between stations. I and a few others tired to catch a little sleep between stations, and it was always tough to wake up, get into a cold, wet, survival suit (those orange ones you see in the pictures), and go back on deck. But, once we got out there last night, we warmed up quickly and the stations went smoothly. And, at the last station, we got to see sunset around 2 AM. Since we hadn’t seen the sun in day, it was a treat! Once we wrapped up, most everyone got a little extra sleep before the next CTD stations, but we al stayed awake in order to go ashore at Little Diomede Island. Despite the bad weather (high winds and fog) of the previous days, today dawned bright and fogless, and those of us wishing to go ashore got into our warm clothes and either a survival suit or a life vest, and went in to Diomede in a rubber zodiac. It was well worth the trip to have a chance to visit Little Diomede, a small island in the middle of the Bering Strait, with the Chukchi Sea to the north and the Bering Sea to the south. On a clear day like today, we could see the Russian island of Big Diomede in the distance. At their closest point, Little Diomede and big Diomede are approximately 2.4 miles apart. The international border and the international dateline separate them and thus, despite their proximity, they are 20 hours apart, and it was actually Monday on Big Diomede!
As we approached the shore, we could hear the sounds of thousands of birds and we watched them fly overhead. You might remember, from my journal about Michael, the “birdman” on board, that Little Diomede is home to colonies of three species of auklets (least, crested, and parakeet) as well as other birds. The entire settlement of approximately 150 people takes up only a small area of the rocky coast and, because the island is accessible only by helicopter or boat, the community is subsistence based. The people hunt beluga and bowhead whales, seals, walrus, and polar bear, and they supplement their diet with fish, crab, local wild greens and vegetables.
Now that we’re back on board, our mud team is getting ready for a long series of eight stations that will begin around 10 PM and end sometime late tomorrow afternoon, depending on whether we take a break in between. It’s so interesting to be on board a ship where science is taking place. Even with this relatively small science team, there’s usually something happening 24/7, either on deck, by the CTD, in the lab, or at someone’s computer. Combined with almost 24-hour daylight, it makes it tough to remember the day of the week or when you’ll have to be ready for your next job.
Pictures:
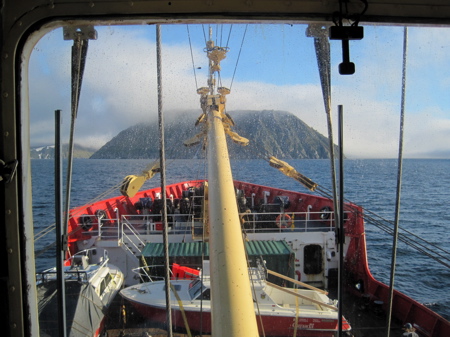
This picture from the ship gives you a good view of the Little Diomede Island.
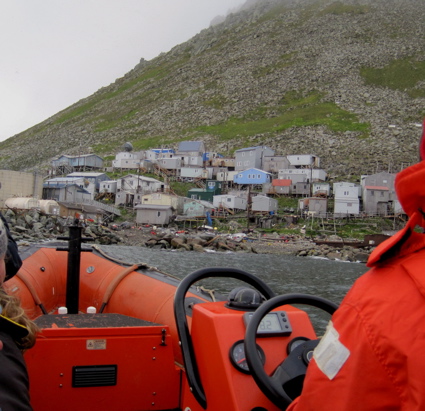
Those wanting to go in rode in a zodiac.
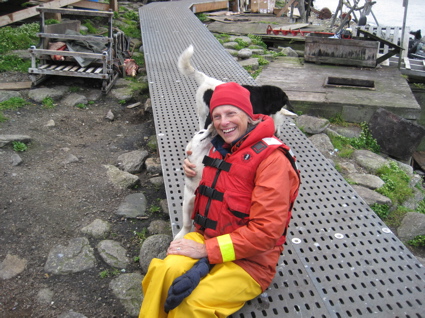
I made friends with a couple of the dogs on Little Diomede.
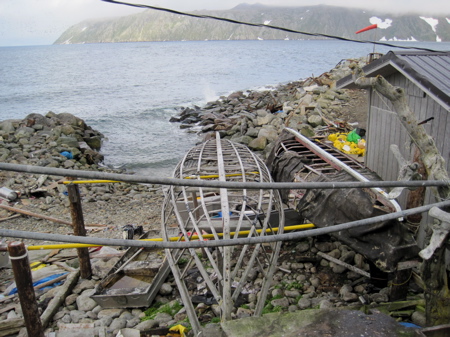
These boat frames will be covered with walrus hide and used for hunting.
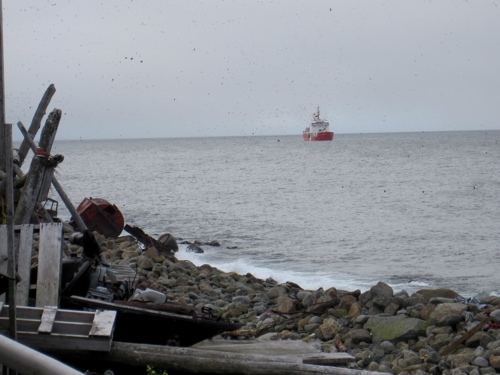
Looking back at the Laurier from shore.
July 19-20
Our last long run of stations ended last night, close to midnight. We had started them in the evening on the 18th, and thus managed to complete them in approximately 25 hours. Coupled with the previous run that had kept most of us up throughout the night, and the following day’s visit to Diomede during what should have been a catch up on sleep period, everyone was pretty tired when we went out on deck for our last mud grabs at 8:30 PM. All of our previous mud stations had gone smoothly with the van Veen grab, and we had been getting one or sometimes two cups of organisms per grab after sieving. The cups range in size from 4 ounces to 32 ounces, and we had been using primarily 8 and 16 ounce cups. Last night, as soon as soon as we dumped the mud from the first grab we realized that it was full of gravel. That makes sense as we were close to shore, just off Point Hope. But, it meant that, once we sieved the mud, we were left with sieve boxes with a layer of gravel on the bottom. Since the gravel potentially contained organisms that Jackie would need for her work, we collected and preserved all of it. When we were done, we had eighteen 32 oz. cups and one 16 oz. cup, all full of gravel with some organisms in each one. Although we were on station for considerably longer than usual, the bright sunshine and blue skies made it much easier.
This afternoon, I spoke with Captain Mark Taylor. Captain Taylor has been with the Laurier since 2000, and has been working in the Canadian Coast Guard for 37 years. Born in Ireland, he’s been in Canada since his family came in 1957. He began his career working on the Great Lakes, first on a small buoy tender and finally as captain of the largest ice breaker on the Great Lakes. After 7 years in an office job in Pacific Region, where he helped to bring science aboard Coast Guard ships, he came back to sea in 1997. Prior to 1997, the Laurier would leave Victoria and steam straight to Barrow where it would then begin working to clear a passage for the barges bringing supplies to the coastal settlements. From 1997 on, the Laurier has supported the work of countless science teams as they conduct research in the Gulf of Alaska, the Bering Sea, and up into the Arctic Ocean. As he begins to think about retirement, Captain Taylor is looking forward to spending more time with his family as his children are growing up. In the immediate future, however, he’ll complete this cruise on August 10 and leave on the 19th to board a cruise ship, the Bremen, where he’ll serve as the ice pilot as the ship moves through the northwest passage.
When I asked him about changes he’s seen in his time coming up here, the Captain mentioned, as almost everyone does, the changes in the ice conditions, and he described the ice as much more dynamic. With thinner ice and the movement of the multi year ice, he has seen different “choke points,” as the ice is pushed new areas. He’s also seen considerable permafrost melt and he related it to the work that the coast guard does to maintain 167 beacons along the coast from the border with the United States to Bellot Strait. Due to the melting permafrost and resulting erosion, some of the beacons have been undermined & tipped and must be repositioned; check out the picture below.
![]()
Captain Taylor had this picture of one of the beacons, where the Beaufort Sea had undermined 2 of the legs as a result of melting permafrost and waves causing erosion.
Captain Taylor at our farewell barbeque on the back deck off Barrow